Accelerating Real World SQL Workloads with PernixData FVP

It's one thing to test various acceleration tools with Iometer and another to demonstrate real world performance. For this series of posts I thought that I would post some graphs for a few standard enterprise applications from a production implementation. This post covers MS SQL Server.
For some background the environment was an 8 node ESXi 5.0 Update 2 cluster with Dell M620 blade servers, 10 Gb networking, FC storage connectivity, and a back-end array with about 250 spindles (a combination of FC, SAS, and SATA disks) able to deliver approximately 35,000 - 40,000 IOPS. PernixData FVP 1.0 was installed with a 400 GB Intel S3700 SSD drive in each host, and a little under 200 VMs were accelerated with write-back (WB) + two peers for redundancy. I could have chosen to accelerate only specific workloads but since FVP pools all flash within a cluster and provides write redundancy (and thus the ability to use larger and cheaper MLC flash drives), I decided to accelerate nearly all of them. The performance gains might not be as large per VM as it might be if I was more selective with which VMs could use the flash, but this way every application could see huge benefits instead of just a few.
The server names have been changed to provide a description of the primary application running on them.
MS SQL Server 1
Description: Windows Server 2008R2 Std running SQL Server 2008R2 Std.
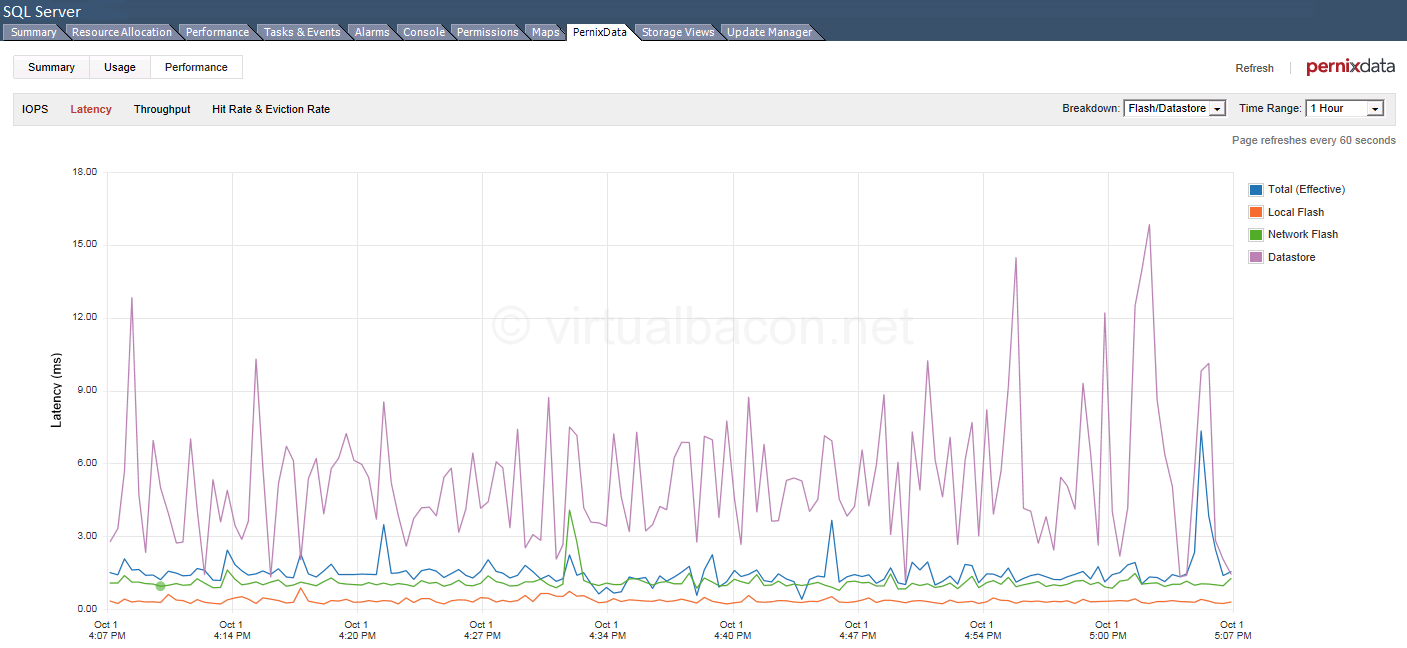
This SQL Server is the backend for multiple dev/test environments for an Oracle PeopleSoft implementation and hosts several databases. You can see the purple line in the graph which shows latency from the datastore varying from a low of 2 milliseconds which is very good, to over 16 milliseconds which is not so good. The orange line is the flash latency which is consistently under 1 millisecond, and the blue line which represents the effective latency as seen by the VM - which includes the two peers of write replication - shows a latency hovering around 1.5 milliseconds. Keep in mind that this is a one hour timeframe in the afternoon. This pattern stays this way most of them time after hours during the busy time of backups. Nightly SQL backups mean that the data is often hot and in flash so it can be backed up faster.
Latency:
For comparison, below is a latency graph for another SQL Server which hosts databases for many applications, including application tiers, "fat clients", and browser-based clients.
MS SQL Server 2
Description: Windows Server 2008R2 Std running SQL Server 2008R2 Std
As was the case above you can see that the latency over the datastore varies between 2-3 milliseconds - again very good - to frequently between 13 and 20 milliseconds, and even over 65 milliseconds - not so good. Notice however that the flash latency is consistently in the 1-2 millisecond range with the effective latency around what appears to be in the 1.5 -2 millisecond range - including the write replication, with occasional brief spikes to 10 milliseconds or less. An example of when a spike might occur would be when a cold read is made from the backing datastore.
Latency:
The examples above from real MS SQL Server workloads in a mid-size enterprise production environment clearly demonstrate the improvement you can see in your environment when leveraging PernixData FVP and a small amount of flash in each ESXi host. Note that these graphs were taken near the end of the day though similar and even greater improvements were seen throughout the day when large groups of employees began accessing applications within a short time frame. Huge benefits were also seen after hours during the backup window when latency regularly crept up to high levels for prolonged periods of time. After this implementation high latency was only seen on the VMs in two other clusters which were not yet accelerated. Hopefully this will be rectified next year when those clusters get the FVP treatment.
Stay tuned for follow up posts showing improvements to other enterprise applications.


