Speeding Up Real World Sharepoint Workloads with PernixData FVP
Continuing the series of posts on real world acceleration of enterprise applications this post demonstrates results of accelerating SharePoint 2010 workloads in a mid-size enterprise environment. I cover both SharePoint Application servers as well as a SharePoint Search server.
A quick refresher on the environment:
- 8 node ESXi 5.0 Update 2 cluster with Dell M620 blade servers
- 10 Gb networking
- FC storage connectivity
- Back-end array with about 250 spindles (a combination of FC, SAS, and SATA disks) able to deliver approximately 35,000 - 40,000 IOPS.
- PernixData FVP 1.0 installed with one 400 GB Intel S3700 SSD drive in each host.
- A little under 200 VMs accelerated with write-back (WB) + two peers for redundancy.
The server names have been changed to provide a description of the primary application running on them.
SharePoint 2010 App Server 1
Description: Windows Server 2008R2 running SharePoint 2010
Latency:
In the graph below you can see that latency from the datastore varies between around 2 ms - very good, to frequently around 8 ms, and at times briefly over 30 and even 40 ms! The local flash device however provides consistent latency around 1 ms or less, and effective latency to the SharePoint VM is around 2-3 ms including 2 write-back peers for write redundancy. When the datastore latency spiked to over 40 ms the effective latency was around 15 ms, and when the datastore latency spiked to around 35 ms the effective latency to the VM was 2 ms or less!
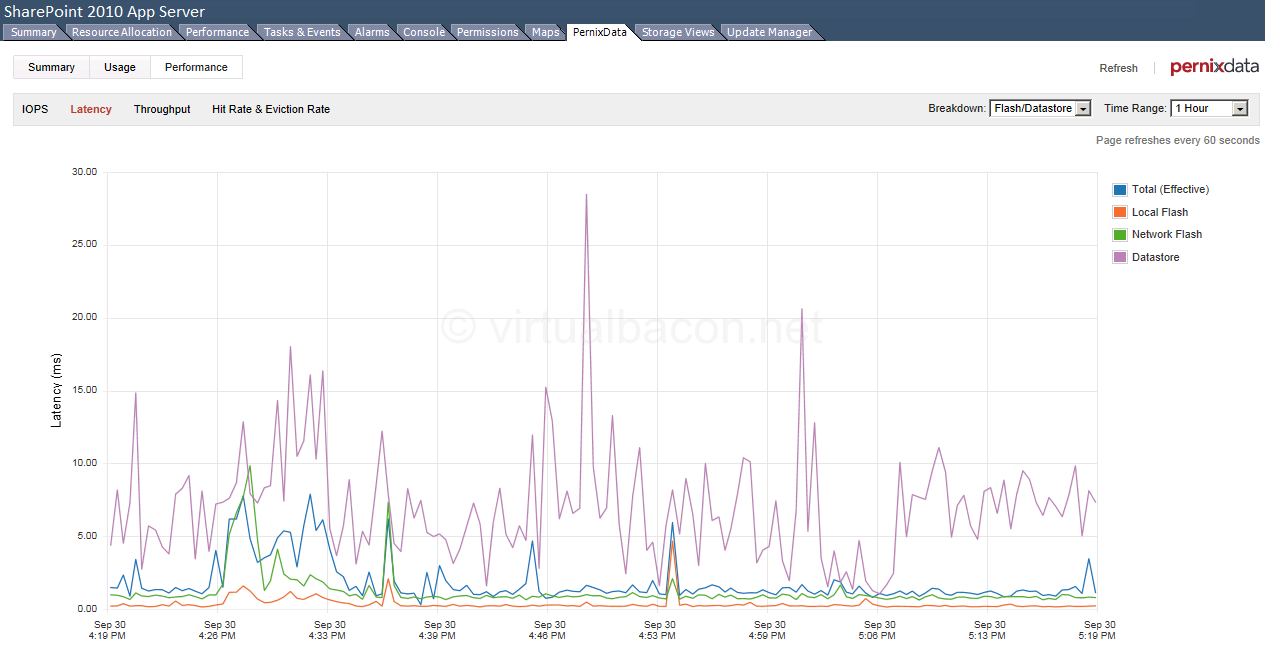
SharePoint App Server 1 Latency DS 1 Hr
Latency Read/Write:
The graph below breaks out read and write latency for the VM. The point of this graph is to show some of the analytics provided by PernixData FVP and how they can help you understand the read/write behavior of specific VMs and applications. Custom breakdown chart options allow you to dig even deeper breaking down figures even more.
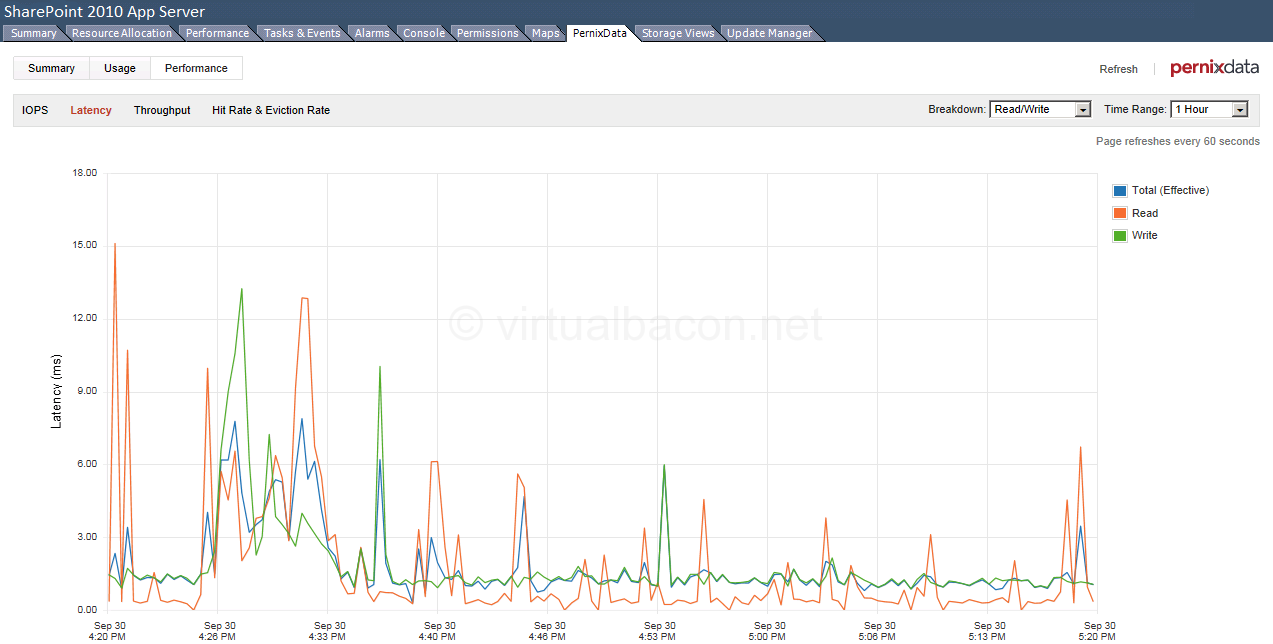
SharePoint App Server 1 Latency RW 1 Hr
Throughput Read/Write:
Same as above but for throughput.
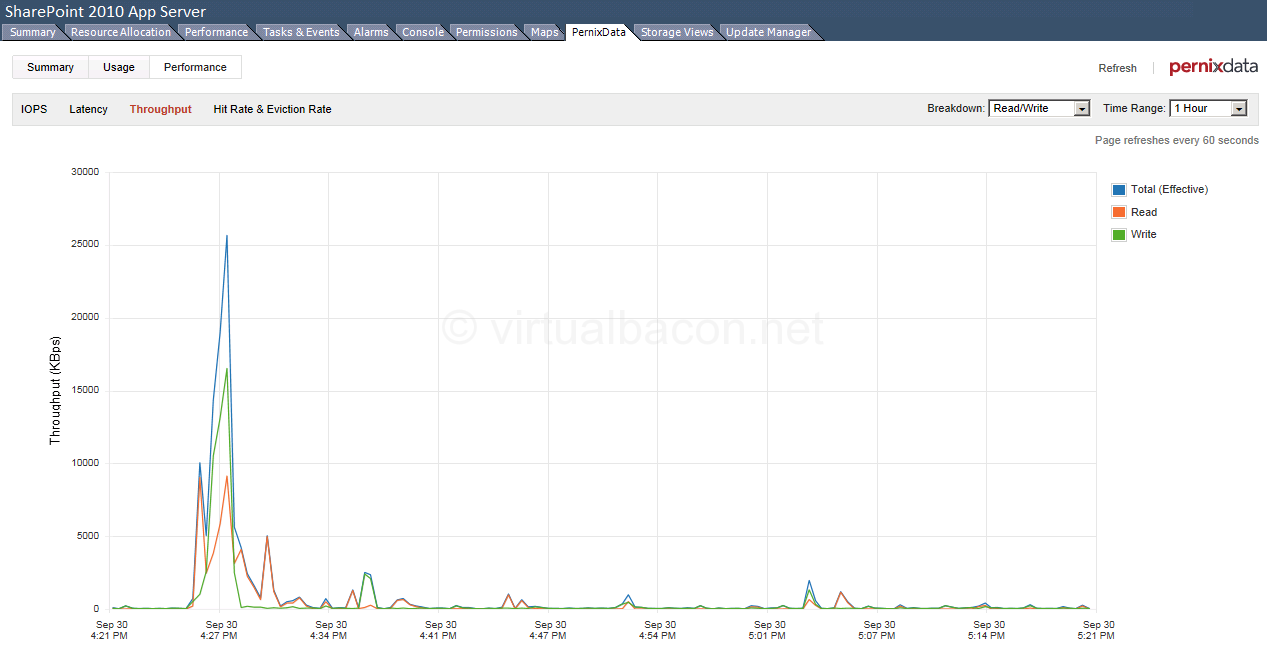
SharePoint App Server 1 Throughput DS 1 Hr
Hit rate/Eviction rate:
The cache hit rate for the app server shows that while it is frequently around 100% there are a number of reads to the back-end array for new reads.
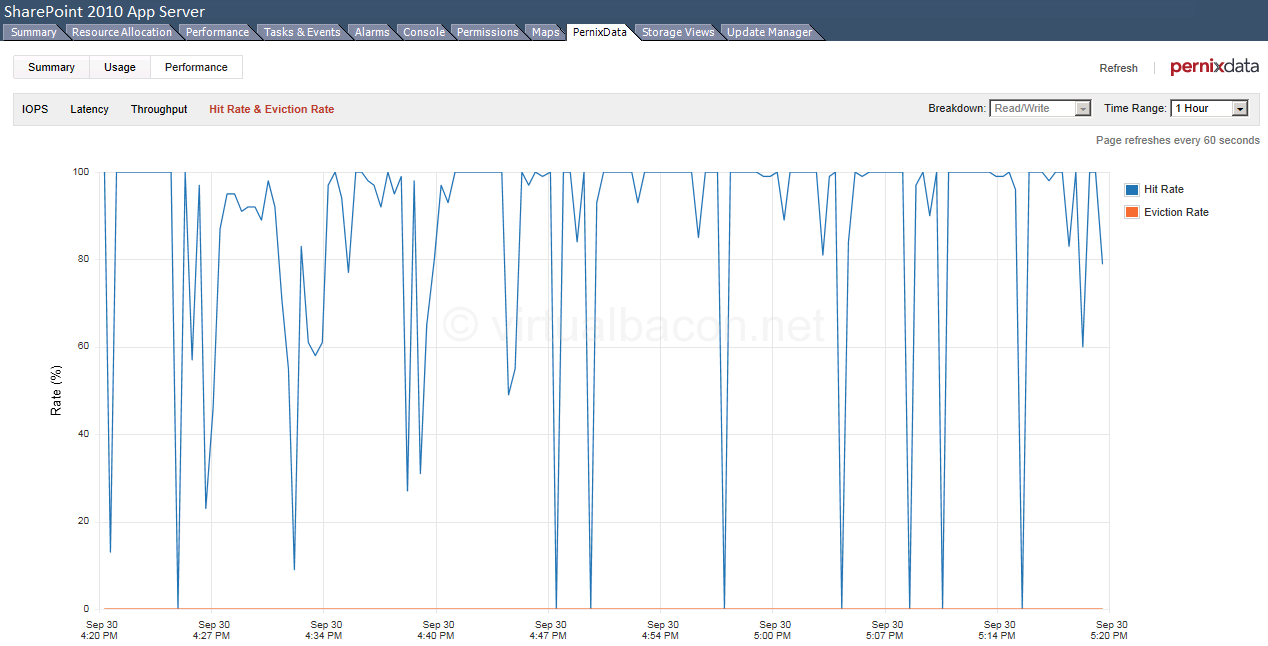
SharePoint App Server 1 Hit Rate 1 Hr
SharePoint 2010 App Server 2
Description: Windows Server 2008R2 running SharePoint 2010
This server is the other node of a load balanced pair with the server above. The datastore latency backing this VM does not spike as high as the datastore backing the other VM (they are on different datastores and hosts for redundancy and availability), but the benefit of accelerating both reads and writes is apparent with latencies pretty consistently in the sub- 1 ms to 2 ms range, with the occasional spike slightly above that.
Latency:
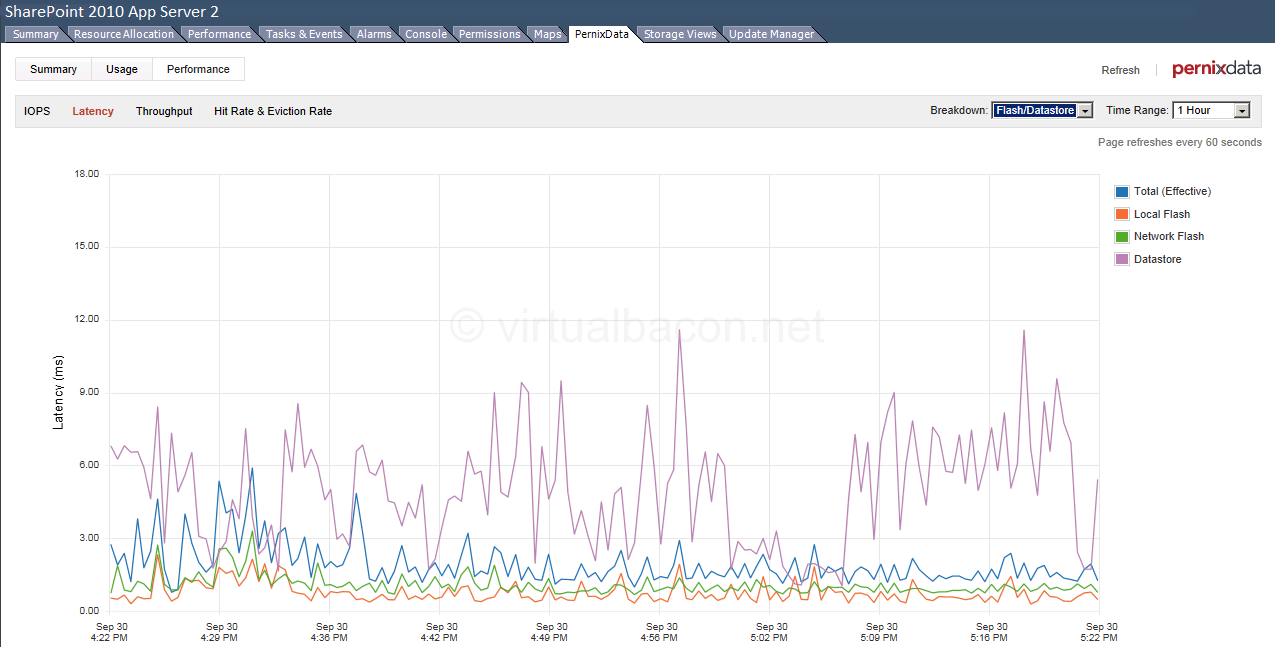
SharePoint App Server 2 Latency DS 1 Hr
SharePoint 2010 Search server
Description: Windows Server 2008R2 running SharePoint 2010 Search server
Latency - datastore:
The graph for the search server below shows datastore latency fluctuating in the 2 ms to 10 ms range with spikes to nearly 35 ms and even 45 ms. The numbers are similar to the first SharePoint application server above and these two VMs may be running on the same datastore. As before however the local flash latency is very consistently in the sub- 1ms to 1.5 to 2 ms range with the occasional rare brief spike twice in an hour. At the point that datastore latency spikes to around 45 ms the effective latency to the VM is about 1/3rd that, and at the datastore latency spike of around 35 ms the latency to the VM is around 2 ms, about 17 times less. You can see that overall the latency to the VM is frequently about 1/5th what is provided by the backing datastore on the array. This is especially important for a search server.

SharePoint Search Server Latency DS 1 Hr
Hit rate/Eviction Rate:
The graph below shows the hit rate and eviction rate for the VM during the same period as the graph above. As you can see the hit rate is frequently 100%, with the dips showing when data is being read off the back-end array. As this is a search server however the high hit rate is important as it is a reflection of the search speeds experienced by the end users. The eviction rate is 0% meaning that the space on the flash device is being managed efficiently and there is no need to evict data within this time frame.

SharePoint Search Server Hit Rate 1 Hr
The graphs above demonstrate the effect of acceleration for both SharePoint Application servers and SharePoint Search servers in a real world mid-size enterprise deployment. Accelerating the virtual machines gives the back-end array some relief from the extra work that it would normally be doing, and the offloading is multiplied by close to 200 servers. More importantly the SharePoint end-user experience is improved with faster page loads and a much snappier feel to the web sites.
Stay tuned for more real-world statistics of enterprise application acceleration.
Recent Posts
- Deploying the PernixData Management Server Virtual Appliance
- New Book “Designing A Storage Performance Platform” by Frank Denneman Available for Download!
- vExpert 2016 Application period is open!
- PernixData at VMworld US 2015
- PernixData at Virtualization Field Day 5
- Avoid problems when removing datastores from ESXi
- PernixData FVP 2.0 Overview
- Designing for Failure: Networking
- Reading S.M.A.R.T. disk data in ESXi
- Real World IIS/.Net Workload Acceleration with PernixData
- Blade Servers: Boot options for leveraging server-side flash
- Real World Domain Controller on FVP
- Swing by the Las Vegas VMUG Holiday Party on Dec. 6!
- Holiday vBeers tonight at 5:30 at the Bellevue TapHouse
- Speeding Up Real World Sharepoint Workloads with PernixData FVP
- Accelerating Real World SQL Workloads with PernixData FVP
- Portland VMUG on Nov 12, 2013
- Why you should join your local VMware User Group (VMUG) – and participate!
- A New Chapter – PernixData
- A Look at the Brocade 6510 Fibre Channel Switch
Categories
- Certification (5)
- Community (7)
- Event (1)
- Firewall Administration (1)
- Hardware (5)
- Network Administration (8)
- Performance (12)
- Storage (9)
- VDI (1)
- Virtualization (37)
- Windows Administration (2)
Tags
#vDB Blogroll
- BrainFloss
- Damian Karlson
- Gabriel Chapman
- Jason Langer
- MWPreston Dot Net
- Valco Labs
- VMCutlip
- vSential
- vTesseract
- WhiteBoard Ninja
Blogroll
- A glimpse into the life of IT
- blog.scottlowe.org
- Cloudjock.com
- Eric Sloof
- Frank Denneman's Blog
- Seattle VMUG LinkedIn Group
- Seattle VMUG Page
- Seattle VMUG Twitter Feed
- VMware Blogs